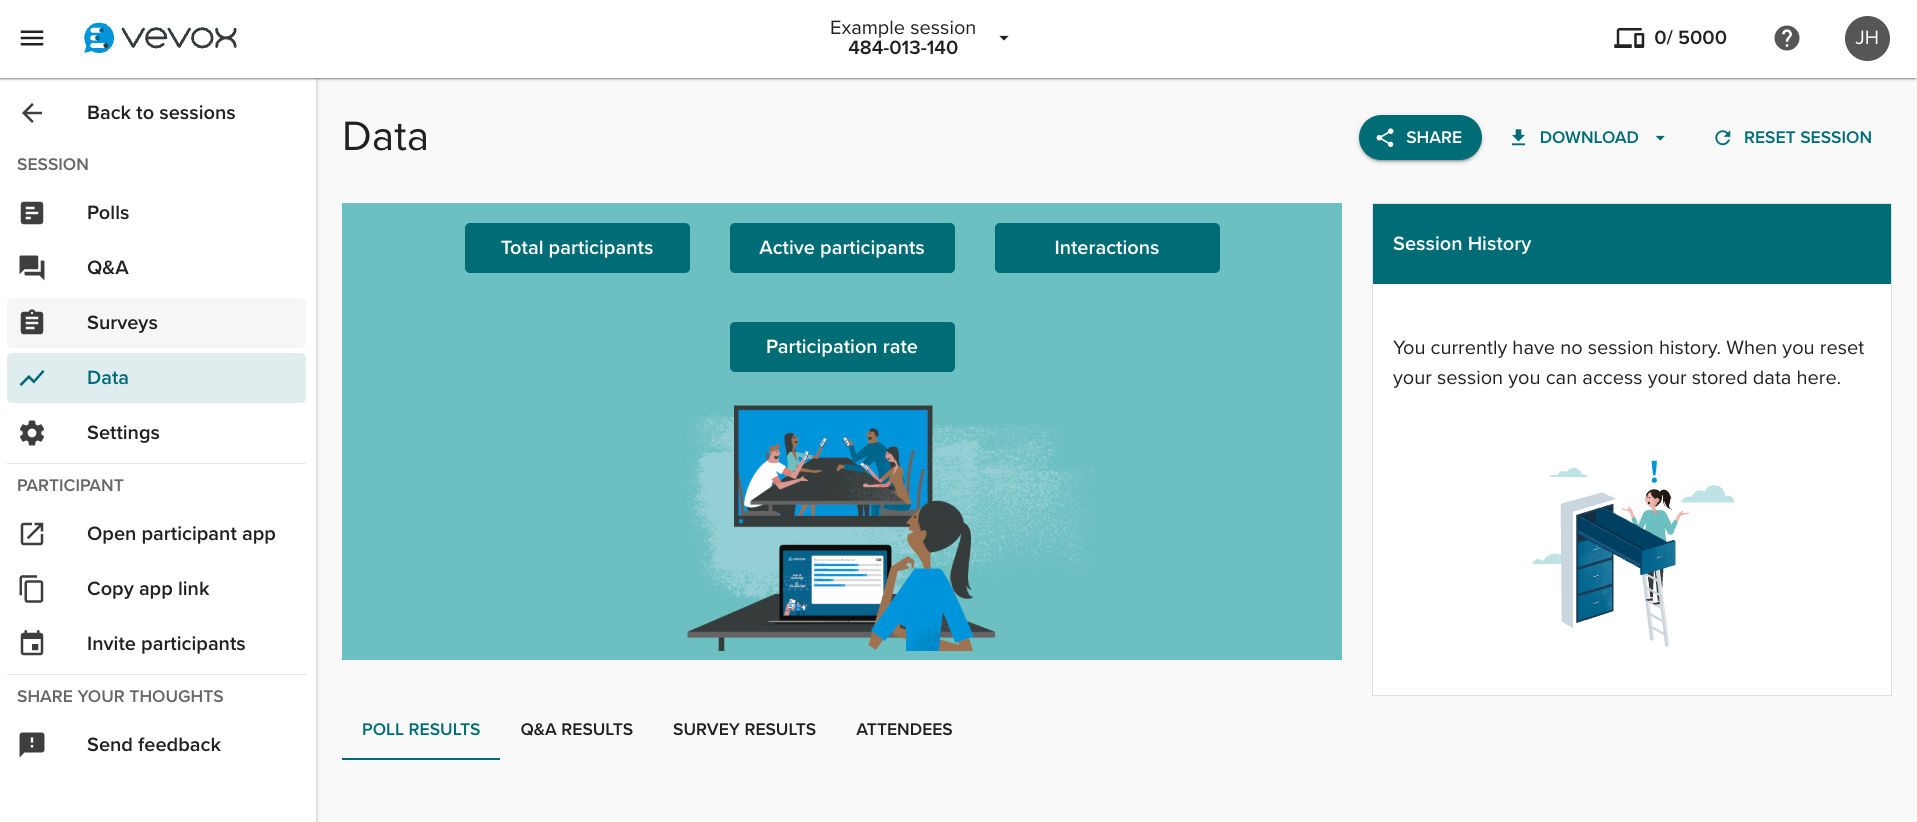
Total Participants
The total number of unique participants that joined your session since it started.
Active Participants
The total number of participants who have been partaking in answering polls and survey questions, submitting Q&A ideas, and commenting and liking questions and ideas.
Interactions
The total number of all interactions from the participants including poll responses, Q&A likes, and submissions, as well as survey responses.
Participation rate
A percentage showing the proportion of total participants who actively engaged (Active Participants ÷ Total Participants).
Poll Results
See a summary result of each poll and a detailed breakdown of how each participant voted on each poll.
Q&A Results
See a summary of all messages sent, including number of likes, if they were published or not, and the time that they were sent.
Survey Results
See a detailed breakdown of how each participant voted on each survey question.
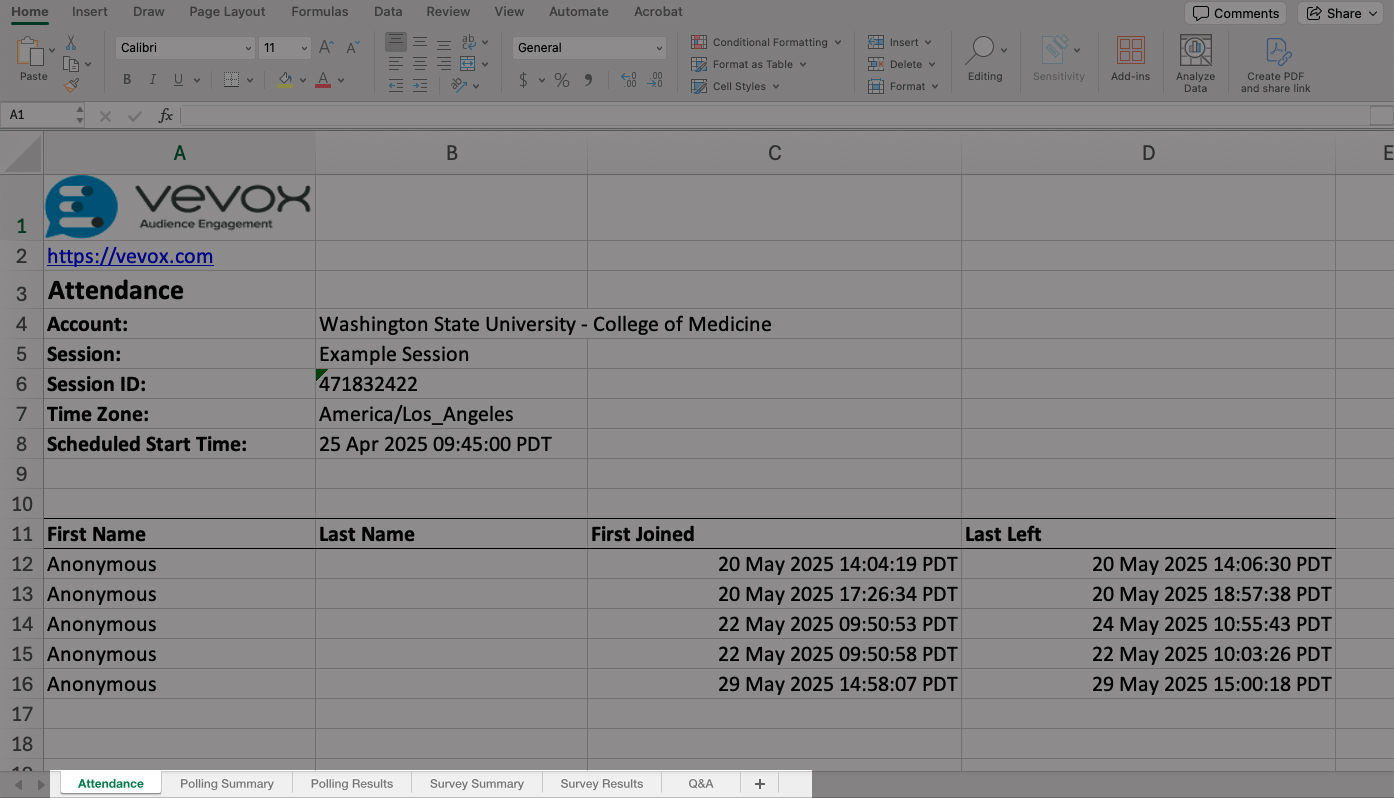
Attendance
See who attended your meeting, including what time they joined and what time they left.